


INTRODUCTION
Malaria transmission in Thailand is seasonal with sporadic epidemics. The large-scale implementation of control interventions, such as insecticide-treated bed nets, indoor residual spraying, and prompt, free-of-charge diagnosis and treatment has achieved a marked reduction in malaria incidence from 49,521 cases in 2011 to 24,364 in 2015 [1]. The recent annual parasite incidence (API) in 2015 was 0.37 per 1,000 populations. Despite considerable reduction of the total malaria cases, Plasmodium vivax is still prevailed in many parts of the country. The proportion of P. vivax to P. falciparum cases increased from 18.9% in 2011 to 63.2% in 2015 [1]. Thus, the importance of P. vivax species should be increasingly recognized. In contrast to P. falciparum, transmission of P. vivax is more difficult to interrupt because of its dormant liver forms that relapse after clearance of the primary infection, gametocyte production before the occurrence of symptoms, and asymptomatic infections that remain undetected and thus untreated. Most of malaria researches in Thailand based on P. falciparum that causes severe and complicated malaria provide useful knowledge on various drug efficacy, drug resistance, molecular markers of drug resistance, and population genetics of parasites from different transmission areas of Thailand. However, P. vivax malaria is usually considered as a benign disease, and the knowledge of this parasite has been limited, especially the knowledge on genetic variations of isolates from different endemic areas of Thailand.
Chloroquine followed by 14-day primaquine is the current treatment regimen for P. vivax infection in Thailand; its efficacy is still high. However, monitoring of chloroquine drug efficacy during the year 2009–2010 in 4 different high transmission areas, i.e., Mae Hong Son (MH), Yala (YL), Kanchanaburi (KN), and Chanthaburi (CB) Provinces indicated different drug responses as shown by different parasite clearance time (PCT, time taken for parasitemia to become undetectable by microscopy) [2]. In that study, 1 of the 5 patients with reappearance of the parasite within 28-days follow-up had the level of chloroquine/desethychloroquine above the minimum effective concentration implied to P. vivax resistance in one of the sentinel site (KN). The difference may be caused by the genetic difference of P. vivax parasites from different geographic origins as illustrated in P. falciparum malaria in Thailand [3,4]. Understanding parasite genetic difference and its population structure are useful to elucidate the spatial distribution of parasite populations and to predict outbreaks and spread of drug-resistant parasites [5]. Thus, we carried out this study aiming to examine the population genetics and structure of P. vivax isolates from 4 provinces with different malaria endemic settings in Thailand.
MATERIALS AND METHODS
Samples and study sites
Assuming a 10% treatment failure rate and a required precision of 10% around a confidence level of 95%, the minimum sample size was calculated at 50 patients for each site. Total 234 blood samples with P. vivax mono-infections were collected in 4 high malaria transmission areas (Fig. 1), i.e., Mae Hong Son (56 samples), Kanchanaburi (68), Yala (55), and Chanthaburi (55). Of these, 212 blood samples were obtained from a previous efficacy study during the year 2009–2010 aiming to assess the efficacy of chloroquine and primaquine for the treatment of P. vivax mono-infection [2], i.e., Mae Hong Son (56 samples), Kanchanaburi (48), Yala (53), and Chanthaburi (55). In addition, 20 samples from Kanchanaburi and 2 from Yala were included in this study. The additional samples were collected during the same period but were excluded from the previous efficacy study because of incomplete following-up of patients. The blood samples obtained from these patients before treatment were genotyped in this study. The study protocol was approved by the ethical committee for research in human subjects, Department of Diseases Control, Ministry of Public Health, Thailand.
Sample collection
Blood samples were collected from P. vivax malaria patients. Inclusion criteria were uncomplicated P. vivax mono-infection confirmed by thick and thin blood films microscopy; parasitemia between 250 and 100,000 parasites/μl of blood; age > 6 months; axillary temperature > 37.5°C or a history of fever in the past 24 hr; informed consent from patient or parent/guardian (in the case of children). Blood from finger prick was collected at day 0 (before treatment) for diagnosis by light microscopy, and 2 blood spots were collected on Whatman 3 mm filter paper, dried at room temperature, and kept in a plastic bag with a desiccator for microsatellite genotyping.
Light microscopy diagnosis
Giemsa’s stain thick and thin blood films were examined for malaria parasites. Positive P. vivax slides was estimated for parasite density by dividing the number of asexual parasites for 200 white blood cells (WBCs) counted and expressed as the number of asexual parasites per ml blood, assuming 8,000 WBC/μl. All blood slides were double-read by 2 technicians and in case of disagreement slides were read by a third senior technician. A slide was declared negative if no parasites were found after counting 1,000 WBCs.
Genotyping
DNA was extracted from blood spots on filter paper with the QIAamp DNA mini kit (Qiagen, Hilden, Germany) following the manufacturer’s instructions and stored at −20°C until further analysis. Six P. vivax microsatellite markers, i.e., PV3.502, PV3.27, MS1, MS5, MS6, and MS16 were used for the genotypic characterization of the field isolates (Table 1). These markers were confirmed by many studies regarding the appropriateness for use in genetic diversity study of P. vivax [7–10]. PV3.502, MS1, MS5, and MS6 were appropriate makers for genetic diversity study, while PV3.27 and MS16 were appropriate for studying multiplicity of the infection [11].
Microsatellite markers were amplified by nested PCR protocol using forward and reverse primers and fluorescence probes as shown in Table 1. PCR amplification was carried out in a total volume of 20 μl, containing 2 μl of DNA solution, 0.25 μM of each primer, 2.5 μM of MgCl2, 0.5 mM of each dNTP, 1 U of Taq Polymerase (Invitrogen, Carlsbad, California, USA), and PCR buffer. The reaction was performed in a Thermal cycler, VERITI® 96-well Thermal Cycler (Applied Biosystems, Foster City, California, USA) with the following protocol; 1 min at 95°C; 40 cycles of 15 sec at 95°C, 30 sec at 61°C and 45 sec at 72°C, and a final 5-min extension step at 72°C. The negative control was run by replacing template DNA with ddH2O to test for the possibility of contamination. Fluorescence labeled PCR products were analyzed by the Applied Bio-systems Genetic Analyzer, i.e., ABI PRISM 3730XL DNA Analyzer (Applied Biosystems) and scored using GeneMapper® v4.0 analysis (Applied Biosystems).
For each locus in each individual isolate, the predominant allele (where multiple alleles were detected) or the single allele was included into the analysis. The predominant allele is defined as the highest peak in electropherogram. Minor peaks taller than 1/3 the height of the predominant allele for each locus were considered to represent multiple alleles per locus. Samples were defined as polyclonal if at least 1 locus presented more than 1 allele. Descriptive statistics were performed using IBM SPSS Statistics for Windows, version 20 (SPSS, Chicago, Illinois, USA).
Genetic diversity analysis
Genetic diversity for each microsatellite locus in each population was assessed by calculating the number of alleles per locus (NA), the expected heterozygosity (HE) per locus and per study site, and haplotypes from haploid data using the Excel plugin software GenAlEx v.6.5 [12]. Haplotypes that appear only once in the population were defined as unique haplotypes. The HE represents the probability of finding a different allele for a given locus in any pair of samples randomly drawn from the same population. It was calculated using the formula,
H E = [ n n - 1 ] ( 1 - Σ P i 2 )
For isolates that were fully genotyped at all loci, analysis of multilocus linkage disequilibrium (LD) (non-random associations of alleles from different loci) was evaluated by determining the standardized index of association (IAS) as a measure using the LIAN v3.5 programme [13]. The significance of the IAS estimate was assessed with Monte Carlo simulation using 10,000 random per mutations of data. Differences of the estimated mean H E for each population and IAS were also calculated.
Population structure and genetic differentiation
The program STRUCTURE version 2.3.4 [14] was used to test whether individuals clustered according to geographic origin, employing a Bayesian approach to identify the number of clusters (K) in the dataset without any prior information on the origin of the population. Structure runs were performed exploring K from 1 to 5 (10 iterations each), consisting of a burn-in period of 50,000 iterations followed by 100,000 Markov Chain Monte Carlo (MCMC) iterations, assuming a mixture model and correlated allele frequencies. The admixture model was used in all analysis that allows for the presence of individuals with ancestry in 2 or more of the K population. The most likely K was defined according to Evanno et al. [15] by calculating the rate of change of K (△K) using STRUCTURE HARVESTER v 0.6.94 [16]. The haplotypes with > 85% ancestry were assigned to a specific cluster for later cluster differentiation analysis. The posterior probability for each number of populations or cluster (K) is computed and then the K value that better explains the genetic data is an estimate of the number of circulating clusters.
Genetic differentiation between populations (FST) was estimated using Wright’s F statistics to confirm if there was strong genetic differentiation within subpopulation [17]. FST estimates ranged from 0 (no genetic differentiation between clusters) to 1 (full differentiation).
RESULTS
Thirty-five of the 234 samples exhibited single allele per locus, indicating a single infection, while the remaining 199 (85%) showed multiple alleles per at least 1 locus, implying multiple infections. When grouping samples according to their areas of collection, a greater proportion of mixed clone infections were found in samples from Yala (YL) and Chanthaburi (CB) Provinces (90.9%), with 10% more than the amount of mixed infections found in samples from Mae Hon Son (MH) and Kanchanaburi (KN) Provinces (80.4% and 79.4%, respectively; Table 2).
Genetic diversity and differentiation among P. vivax populations
Overall, high levels of diversity were observed. All 6 microsatellite markers used in this study were high polymorphic, with the HE of each marker ranged from 0.791 to 0.946 (Table 1). The total number of distinct alleles observed per locus ranged from 7.3 for MS1 to 23.5 for MS16 with an overall mean of 13.1 alleles/microsatellite markers and a mean value of 26 alleles/study site (Tables 1, 2). Multiplicity of infection (MOI) ranged from 79.4–90.9% with a mean of 85% (Table 2).
Strong genetic diversity was observed across all study sites. The expected heterozygosity (HE) values for parasite population ranged from 0.587 to 0.903 (mean± SE= 0.873± 0.021; Table 2). In particular, the MH and KN isolates displayed the greatest level of diversity (mean HE = 0.903 and 0.885), whereas the moderate diversity was observed in YL and CB isolates (HE = 0.587 and 0.695). Isolates from MH and KN Province were quite similar with the highest level of genetic diversity as shown by mean number of alleles (NA; 15.833 and 18.333), HE (0.903 and 0.885), and %MOI (80.4 and 79.4) (Table 2).
Most parasite isolates were highly polymorphic and showed unique haplotypes. Within all populations, 215 different haplotypes were detected, of which 8 haplotypes appeared in more than once in the population, i.e., 3 in population from YL and 5 in population from CB. Shared haplotypes were seen between 3 pairs of isolates from YL isolates and 2 pairs from CB isolates. In addition, 3 haplotypes, 2 shared by 7 isolates, and 1 shared by 3 isolates were present in CB isolates.
Linkage disequilibrium
The analyzed P. vivax populations showed a significant linkage disequilibrium (IAS = 0.133, P < 0.001; Table 2). IAS was also calculated separately for the isolates considering their geographic location, demonstrating significant linkage disequilibrium for all locations (IAS = 0.023, 0.013, 0.152, and 0.309, P < 0.001; Table 2).
Population structure and genetic differentiation
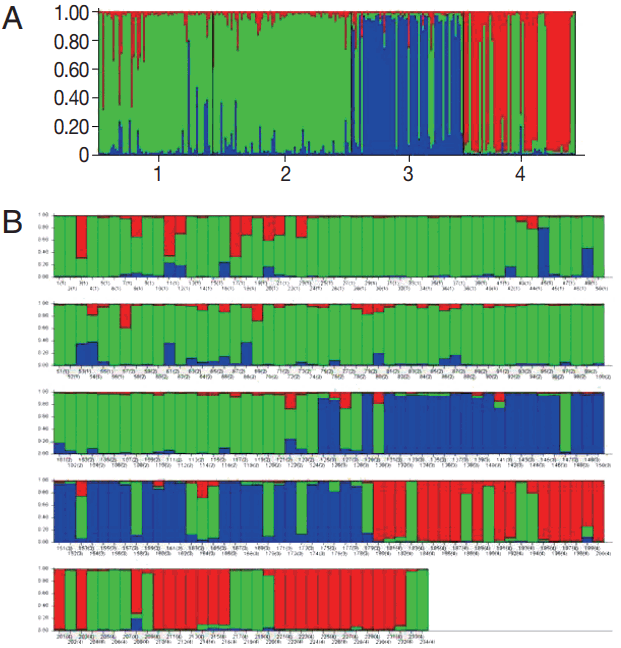
According to the 6 microsatellite data set, cluster analysis showed that the highest Delta K values ( K) was observed at K= 3 (Fig. 2) suggesting that the P. vivax population from 4 high malaria endemic areas of Thailand could be divided into 3 clusters (A, B, and C). Most parasites were admixed as shown by bars partitioned into K colored segments (Fig. 2B). Isolates from CB were clustered into cluster A, MH and KN in cluster B, and YL in cluster C. MH had the highest proportion of admixed population (28.6%), followed by KN (19.1%), YL (16.4%), while CB had the lowest admixed population (9.1%).
FST pairwise analysis showed high and significant genetic differentiation (FST value from 0.204 to 0.471) between the clusters. All values were significantly different from 0 (P < 0.05). The highest differentiation was between CB isolates (cluster A) and YL isolates (cluster C) (FST = 0.471, Table 3).
Genetic diversity comparison according to parasite clearance time
Chloroquine (25 mg/kg divided for 3 days) plus primaquine (15 mg daily for 14 days) is the first line treatment drugs for uncomplicated vivax malaria in Thailand. Two hundred and seven (207) out of 234 total samples had PCT data obtained from the previous study [2]. Of these, 69 samples had PCT within 24 hr and 138 samples had PCT of more than 24 hr. Isolates from patients with PCT>24 hr had higher NA and HE compared to those with PCT within 24 hr, while MOI was similar between these groups (Table 4). In addition, 81.5%, 75.6%, and 98.1% of MH, KN, and CB isolates had PCT of more than 24 hr implying of lower parasite response to the treatment drugs. In contrast, YL isolates had higher response to the drug, and only 13% of YL isolates had PCT of more than 24 hr.
DISCUSSION
We analyzed the genetic diversity and population structure of 234 P. vivax pre-treatment clinical isolates collected in 4 high malaria transmission areas of Thailand. We observed high levels of heterozygosity in P. vivax isolates from all 4-study sites and a high proportion of polyclonal infections (HE = 0.881 and MOI= 85%). The genetic differentiation (FST) was high indicating geographical boundaries between clusters. In concordance with the FST values, the STRUCTURE analysis detected the population structure of P. vivax according to their geographic location (Western, Eastern, and Southern regions, K= 3). These results implied that P. vivax isolates from different origin in Thailand had different genetic structure and could be differentiate parasites from Western (MH and KN isolates), Southern (YL isolates), and Eastern (CB isolates) parts of Thailand. A minority of cluster A and cluster B isolates found in YL (cluster C) supports a high degree of differentiation between isolates from YL and the other 3 provinces. Less genetic differentiation between isolates from MH and KN can be explained by geographic proximity and socioeconomic between the inhabitants of the 2 provinces. Both provinces locate on the western part of Thailand bordered to Myanmar.
The present study clearly demonstrated that population structure of P. vivax isolates from YL and CB were highly different and the genetic diversity of YL isolates was lower than the other 3 Provinces. YL is geographically more isolated than MH, CB, and KN; they are separated by 2,008, 1,329, and 1,098 km, respectively. This is concordance to the epidemiology of malaria transmission in Yala Province. YL locates in the southern part of Thailand bordered to Malaysia while CB locates in the eastern part bordered to Cambodia. Occupation, climate, and culture of people in YL are different from people in MH, KN, and CB. Today, most southern Muslims work in their own rubber plantations or are hired as rubber tappers if they do not have their own land. The way of life of Muslims in the southern border province is different from those of other groups in the country. Malaria patients in YL mostly were indigenous cases infected in rubber plantation areas of the Province. Migration of people is a probably effective way of malaria transmission and for gene exchanges between malaria populations. Migration to and out of YL is limited. In addition, the outbreak of violence of Thailand’s southern province of Yala and Pattani Provinces since the year 2004 prevents people movement from the other provinces to YL. These factors largely hindered gene flow of malaria parasite population between YL isolates and CB, MH, and KN isolates. Therefore, populations of P. vivax in YL appear to act as independent evolutionary units because of limited gene flow.
Genetic structure of P. vivax isolates from MH and KN were similar but very different from YL and CB. The similarity of genetic structure of isolates from MH and KN may result from the location of the 2 provinces and the same mountainous areas. MH and KN locate on the western border with Myanmar. Anopheles vectors are prominent in the mountainous-forested areas leading to high malaria transmission along the western border areas. People living in the hilly pocket villages situated in the forests or forest fringe areas on or near the border of Thai-Myanmar are at risk of malaria infection. The border crossings of people in each site of land borders are also epidemiologically linked with transmission dynamics of both P. falciparum and P. vivax [18].
Chloroquine plus primaquine, the first line treatment of uncomplicated vivax malaria in Thailand is still effective; the cure rate is more than 95% [2]. However, PCT of P. vivax isolates from CB was longer than isolates from YL [2]. CB is a high transmission area situated close to the Thai-Cambodia border where it is considered an epicenter of anti-malarial drug resistance. The resistance situation remains critical in areas along the Thai-Cambodia border, although the incidence of malaria infection has been declining drastically [19]. According to the continuous anti-malarial drug surveillance of the Thailand National Malaria Control Programme, malaria parasite from CB, especially P. falciparum, highly resists to almost all anti-malarial drugs availability nowadays whereas parasite from YL is higher sensitive [3]. Compared to isolates from the western part (MH and KN isolates), CB isolates had less genetic diversity. It may result from the current situation of low malaria transmission in the eastern part of Thailand.
The genetic characteristics classified by PCT were different. The group with PCT of more than 24 hr had higher diversity. The group with PCT within 24 hr comprised most P. vivax isolates from YL while those with PCT of more than 24 hr comprised most isolates from CB. From the previous study [2], mean PCTs were calculated and compared using Long Rank (Mantel-Cox) in the Kaplan-Meier analysis. PCT of patients from CB was significantly longer than those from MH, KN, and YL [2]. The mean PCT was 3.7 days, compared to 2 days of MH, 1.6 days of KN, and 1.1 days of YL isolates. This finding confirmed the genetic difference of P. vivax isolates from YL and CB. The difference of genetic characteristics is likely to relate with disease severity.
A better understanding of P. vivax genetic diversity and genetic structure of parasite population in this study are beneficial to malaria control programme as it is a useful tool to track the source of infections. In addition, it is important for the evaluation and improvement of current efforts for malaria control and elimination.