


INTRODUCTION
Malaria is a life-threatening disease and a major cause of death worldwide. This disease is still one of the top-ranked infectious diseases, following human immunodeficiency viruses and tuberculosis [1]. Over 91 countries responsible for 216 million cases were visited annually by more than 125 million international travelers. Malaria also kills a child every 2 min, with the number of deaths reaching 435,000 in 2017 [2].
Approximately 250 species of the genus Plasmodium can infect mammals, birds, and reptiles, and there are 6 species responsible for human infection [3]. Each species has different features, such as morphological appearance, signs, symptoms, and consequences following appropriate treatment to the patients [4]. Malaria is diagnosed with the patients’ clinical signs, symptoms, and physical findings on examination. The symptoms found in non-acute malaria share similarities with other diseases and potentially lead to misdiagnosis.
Proper and rapid diagnosis is required to reduce the morbidity and mortality caused by malaria. In endemic areas, the detection of asymptomatic cases is still a challenge for blocking the source of transmission. In addition, in nonendemic areas, very low parasite density is commonly found in infected individuals. A highly sensitive test is crucial in detecting low parasite density that may develop into severe disease [5,6]. These issues make diagnostic development a major concern in malaria eradication and elimination attempts [7]. The new malaria diagnostics have continuously developed to achieve excellent performance that is affordable, sensitive, specific, user-friendly, rapid and robust, equipment-free, and can be delivered to various areas [8,9]. This study focuses on P. knowlesi, the fifth human malaria parasite. P. knowlesi infection has become an interesting subject over the past few years. P. knowlesi began to be considered a threat since the infection was found in Malaysia and began to spread across Southeast Asia to Indonesia, Thailand, Myanmar, Singapore, Philippines, Vietnam, Cambodia, and Laos [10,11]. On the other hand, the clinical disease from P. knowlesi infection shows lower severity than P. falciparum infection, but higher severity than infection with those of other malaria parasite species [12]. However, the diagnosis of P. knowlesi is still inadequate enough to be studied. The easiest way to detect P. knowlesi is by microscopy. However, it should have a differential diagnosis from other human malaria parasites. Misdiagnoses that occurred in P. knowlesi which was identified as P. malariae or P. falciparum, led to a fatal outcome.
Other malaria diagnostic tools, such as rapid diagnostic tests (RDTs), has lower sensitivity than molecular tests in detecting P. knowlesi, especially at low parasitemia. Also, the inconsistency of RDTs among developers is another issue when applying them as a P. knowlesi detection method [11,13]. Immunofluorescence assay (IFA), enzyme-linked immunosorbent assay (ELISA), and fluorescence-activated cell sorting (FACS) analysis are considered to have a high sensitivity. However, they are relatively complicated and costly techniques [14,15]. Most of the diagnosis methods require fixation before analysis, and many reports described that fixation using methanol or heat inactivation would negatively affect the outcome of examination [16,17].
To overcome the limitations of current malaria diagnostics, automated microscopy based on computer vision techniques has been developed, and some of them are commercially available. These techniques provide consistency, and accurate diagnosis without the expert needed [18]. Our approach concerned to develop diagnostic techniques that provide malaria detection in a broad spectrum, from the laboratory to the endemic P. knowlesi malaria areas. A novel malaria diagnostic system using a new computer vision called the Biozentech malaria scanner was evaluated in this study. This system is developed by Biozentech, a subsidiary of Korea University Guro Hospital, considered simple, low cost, user-friendly, and highly sensitive. The size of the machine could be easily transferred to various areas, indicating that it was suitable for use in the clinical field.
This study was conducted to evaluate the performance of the Biozentech malaria scanner in in vitro detection of P. knowlesi and P. falciparum parasites. This method has been developed for clinical and laboratory purposes. This technique was given a proper analysis of 0.1% parasitemia or above. In addition, the high range of parasitemia had a similar precision with a low range. In terms of compression, the measured percentage of parasitemia by malaria scanner revealed similarity to microscopy and FACS; however, it has shown different accuracy. The malaria scanner has relatively similar accuracy to FACS and was better than light microscopy. Besides, this technique also has a strong correlation with microscopy and FACS. This study supports malaria eradication, particularly in the development of malaria diagnostics based on a computerized system.
MATERIALS AND METHODS
In vitro cultivation of P. knowlesi A1-H1 (PkA1H1) and P. falciparum 3D7 (Pf3D7)
This study used PkA1H1 parasite, a kind gift from Robert W. Moon, LSHTM. The detail protocol described elsewhere [19]. We used the same method for culturing Pf3D7 strain parasite with slightly different supplementation concentrations: 100 μM L-glutamine (Gibco, Paisley, Scotland), sodium bicarbonate (Sigma-Aldrich, St. Louis, Missouru, USA), hypoxanthine (Sigma-Aldrich), and 0.5% albumax I (Gibco, Auckland, New Zealand). Both parasites were cultured at 2% hematocrit with mixed gases (90% N2, 5% CO2, and 5% O2).
Sample preparation
A serial parasitemia was set at 10, 5, 1, 0.5, and 0.1% to compare sensitivity and reproducibility of the malaria scanner to microscopy and FACS. Two percent hematocrit cultured parasite was serially diluted by 1:1 using 2% hematocrit of healthy RBCs. A couple of ranges of parasitemia were defined as high- and low-range parasitemia. It was set to know the detection limit of the malaria scanner. The high range of parasitemia was set 5.0–0.3%, while the low range was 1.0–0.1%. Each parasite was aliquoted and examined in triplicate by microscopy, FACS, and malaria scanner.
Detection of malaria parasites by microscopic examination
Approximately 200 μl of parasite culture was centrifuged, and its supernatant was discarded. The thin blood smear was made by spotting 2 μl of culture pack cells onto a glass slide, fixed using 100% ethanol, and then applying 10% Giemsa staining solution for 10 min. Parasitemia was counted using light microscopy at 1,000×magnification for 20,000 red blood cells (RBCs).
Malaria parasite detection using a scanner
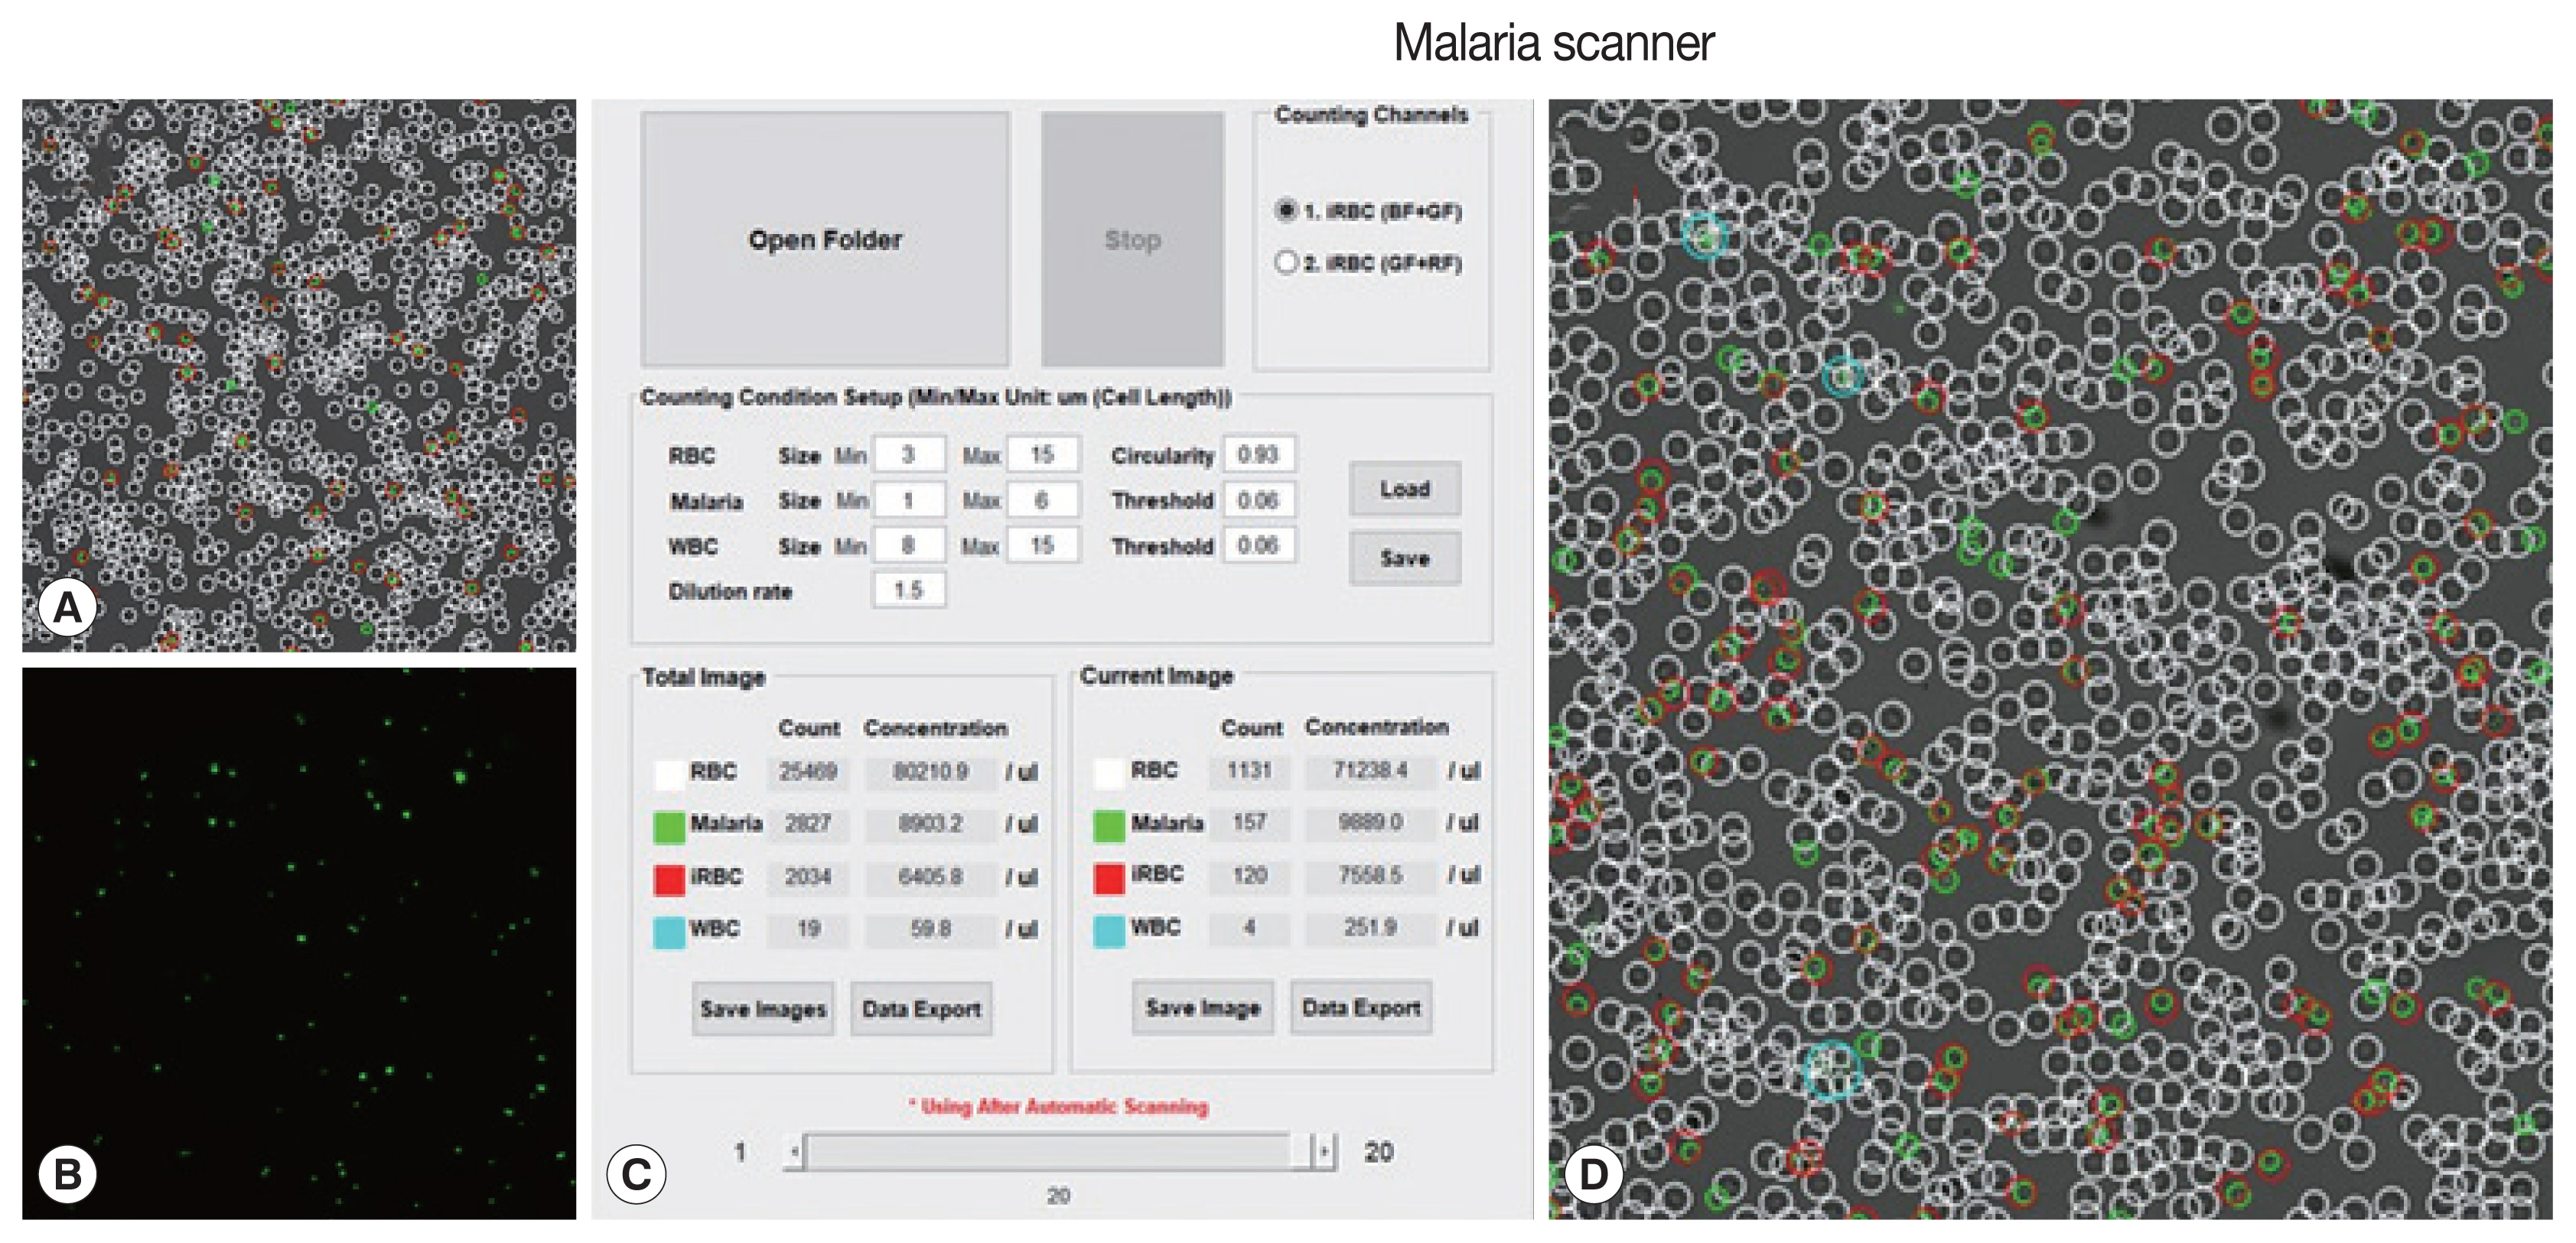
The machine algorithm allowed to classified cells based on their size and fluorescence intensity. Several parameters (size, dilution ratio, intensity, and gain) had been optimized in the prior, resulting in proper detection (Fig. 1). Plasmodium knowlesi A1-H1 culture was diluted 500 times from RBC pack cells using phosphate-buffered saline (PBS). This diluted sample was then mixed with 10× SYBR green I at a ratio of 1:1.5 from the total volume. Then, this mixture was placed in a slide chamber, incubated for 10 min until the culture was stable, and shuttled down on the surface chamber without any movements. The slide chamber was scanned automatically with a slight adjustment after using an autofocused option.
Malaria parasite detection by FACS analysis
To evaluate parasitemia counting analysis of the malaria scanner, a couple of sets of culture PkA1H1 and Pf3D7 parasites were detected and compared with the FACS technique. The parasite was fixed with 0.05% glutaraldehyde following incubation for 10 min at RT. The fixed parasite was then treated with 1:10,000 of SYBR green I. PBS was used for washing before and after applying the dye and for diluting the parasite sample. The sample was examined at 20,000 events of each sample 5 times. The best 3 of the data were chosen for further analysis.
Statistical analysis
The sensitivity and reproducibility of the malaria scanner were analyzed using the standard regression method (GraphPad Software, San Diego, California, USA). The coefficient of variation was calculated by dividing the standard deviation by the mean. Pearson’s correlation test was used to evaluate correlation data coming from all methods
RESULTS
The malaria scanner optimally detected 20 fields from a maximum of 30 fields, each field effectively detected 1,000 cells. The count encountered an error when more than 1,000 cells per field were detected. It was because the overlapping cells were more difficult to focus on resulting data analysis which was unstable and took longer.
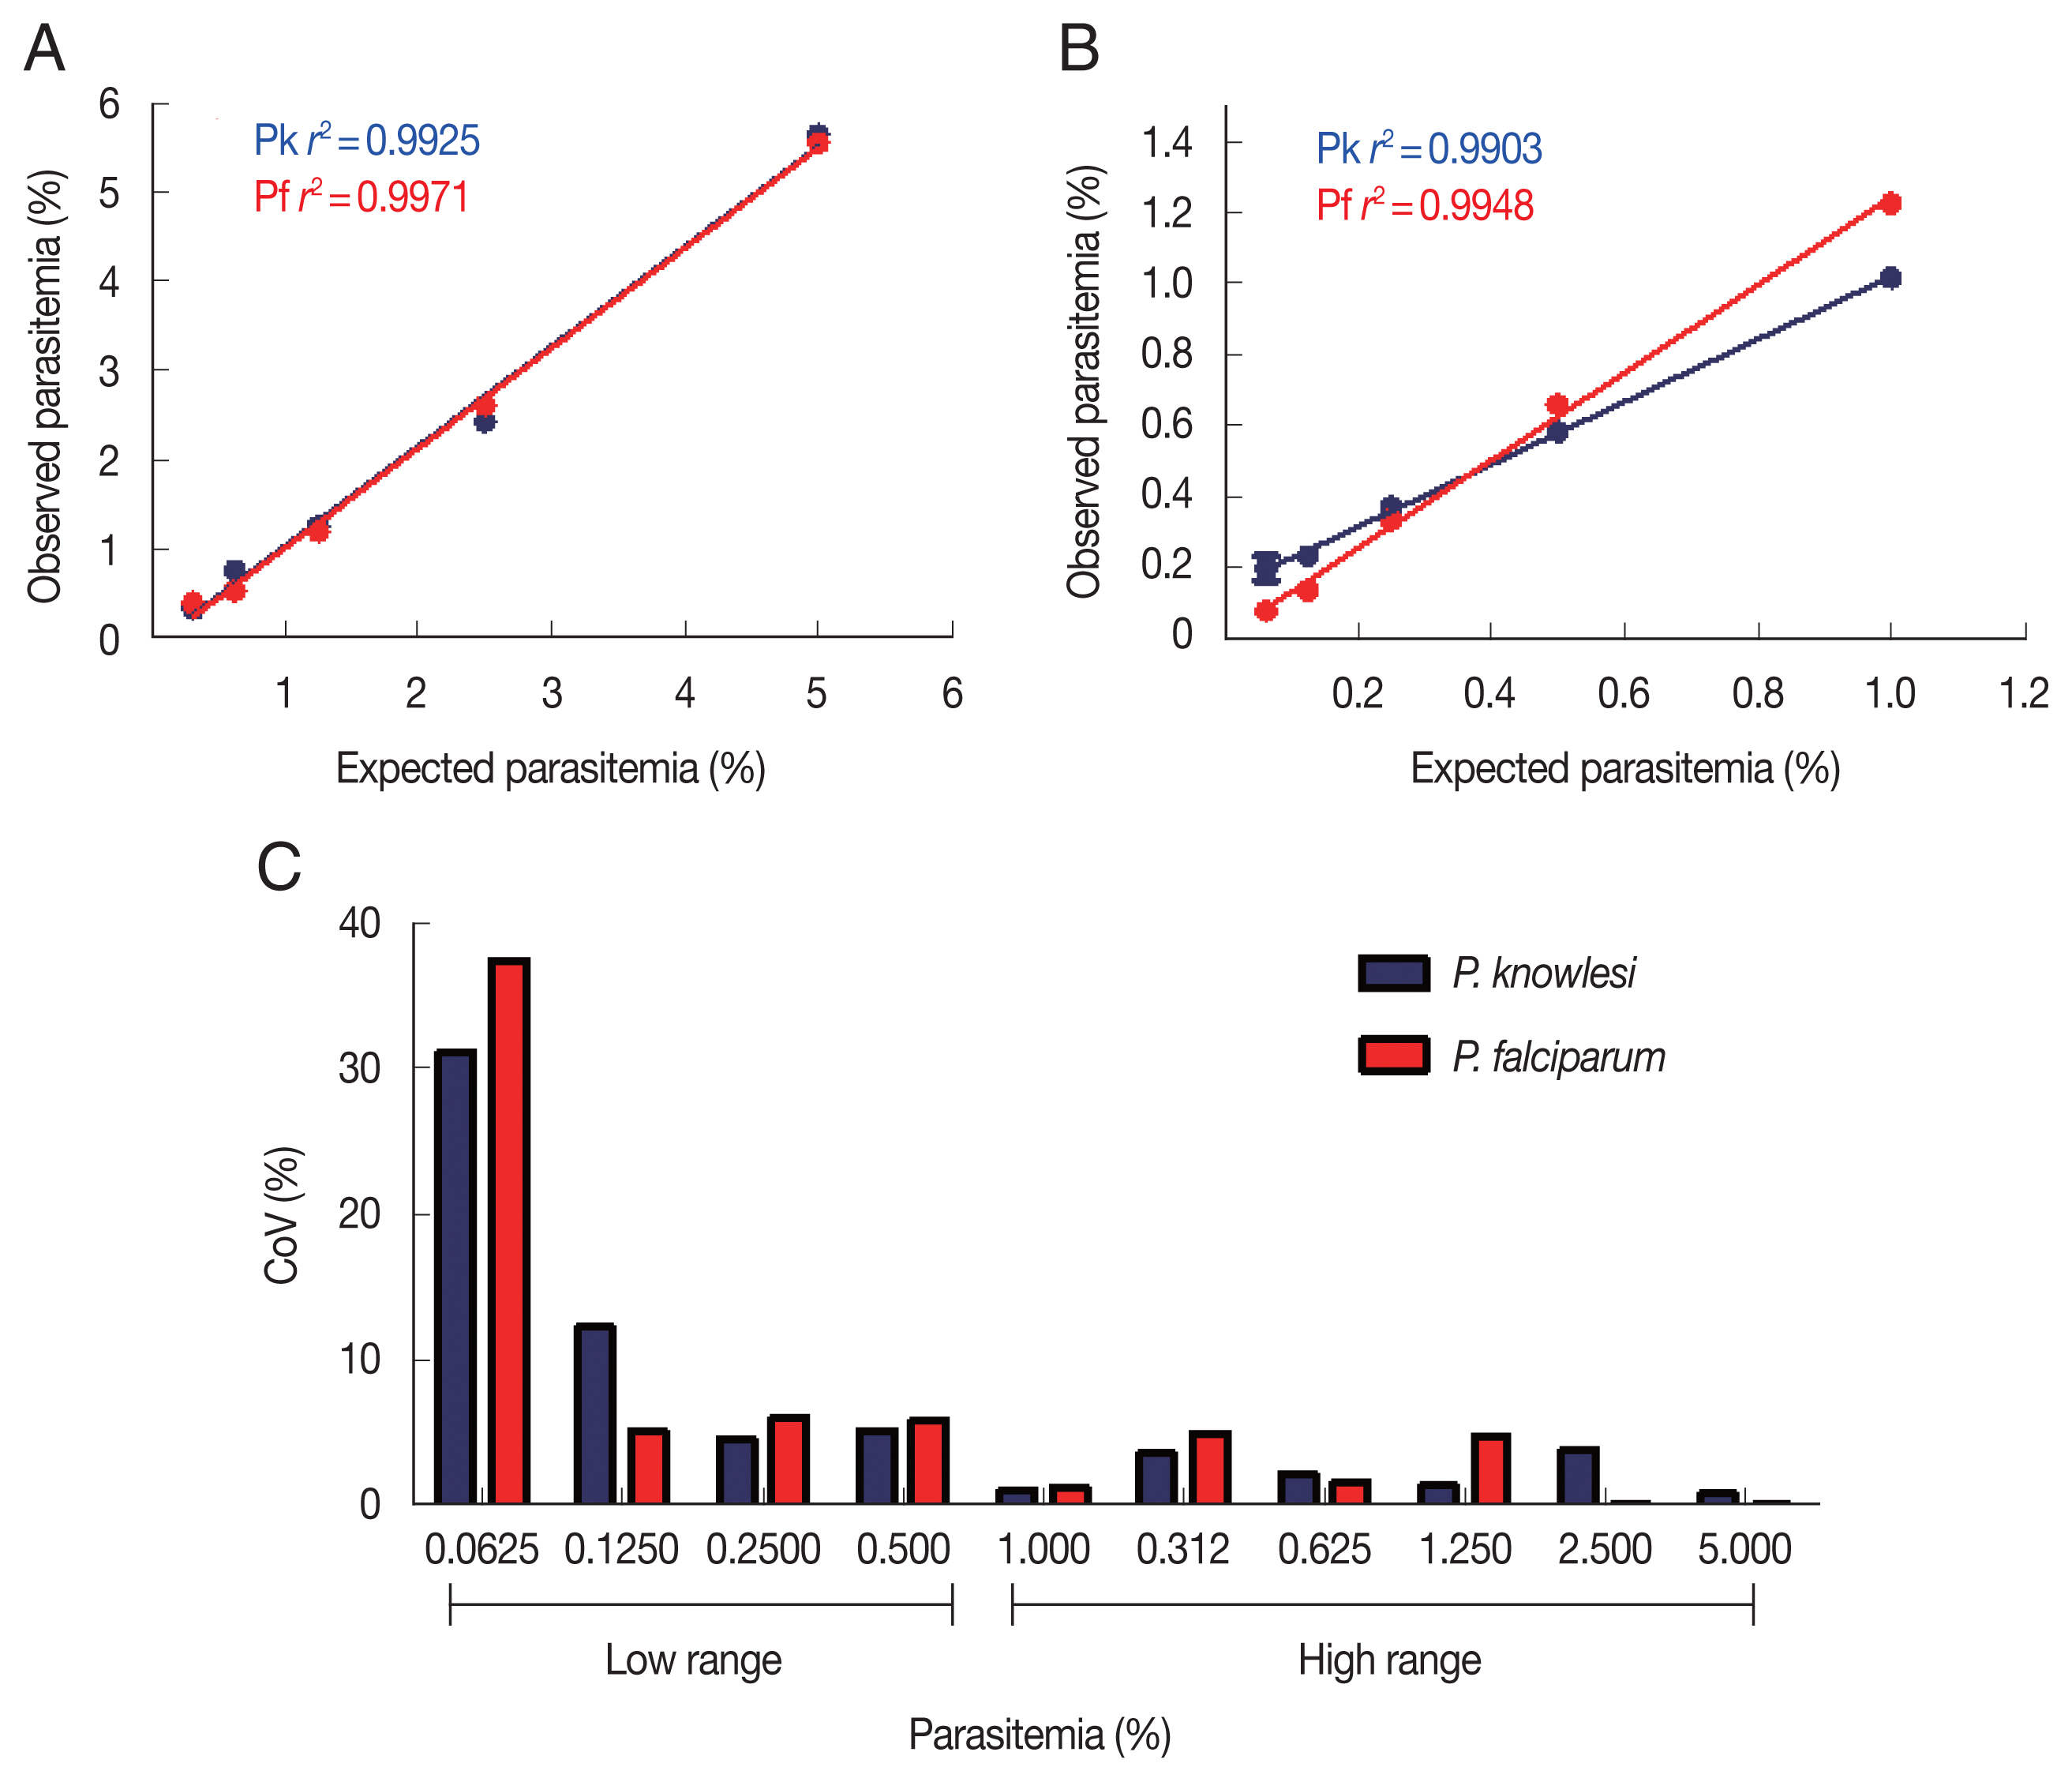
To determine the sensitivity and detection limit of the malaria scanner, we identified 2 different ranges of parasitemia. The sensitivity of high-range parasitemia was relatively similar to the low-range for both P. knowlesi and P. falciparum. Both ranged show a similar correlation between expected and the measured parasitemia. The r2 values from both ranges of parasitemia were 0.9925 and 0.9971, respectively for P. knowlesi and P. falciparum in the high range. Meanwhile, the low range of parasitemia showed 0.9903 and 0.9948, respectively for P. knowlesi and P. falciparum (Fig. 2A, B). Based on the coefficient of variation (CoV), the malaria scanner allowed us to determine the parasite count in 0.1% or higher parasitemia for both P. knowlesi and P. falciparum (CoV ~10) (Fig. 2C, D). The data showed that 0.06% of parasitemia has a CoV greater than 30, which was not considered an acceptable value (CoV <10). Moreover, parasitemia below 0.1% gave a measurement error that detected higher parasitemia than the actual number (data not shown).
Performance evaluation of the malaria scanner was also conducted by comparing its parasitemia with FACS and microscopy. The malaria scanner has higher accuracy than microscopy, but it was similar to FACS. Table 1 described P. knowlesi and P. falciparum by looking at the CoV of each technique. The CoV of the malaria scanner was 1.2–6.7% and 0.3–4.8%, and the FACS was 1.6–11.8% and 1.6–6.4% for P. knowlesi and P. falciparum, respectively. The CoV of microscope was 0.04–28.5% and 0.1–23.1%, respectively for P. knowlesi and P. falciparum. The percentage of parasitemia from all methods showed a strong correlation, as analyzed by Pearson’s correlation tests (r2=0.99, P<0.05).
DISCUSSION
Computer vision plays a significant role in the healthcare sector, in particular for diagnosis of diseases. Excellent accuracy, reproducibility, and cost efficiency are the reasons why computer vision diagnostics should be more developed. Computer vision can exploit morphological objects such as texture, shape, and contour. It allows comparing our results with prior knowledge with contextual information relay to the image sequence, which is helpful in the diagnostic process [20].
Several diagnostic platforms have been created based on computer vision systems for tuberculosis, cancer, and malaria. In terms of malaria, there are several automated microscopy computer vision systems, such as World Health Technology (WHT) automated scanning, autoscope, and automated diagnostic applications [21,22]. To improve the accuracy from wide variations of slide-to-slide and examiner skills, computer malaria diagnostics have been continuously evaluated using clinical samples [23,24].
The analysis used an algorithm that mainly works with object identification following object differentiation between several items belonging to the same group (grouping). Short detection analysis was provided by focusing on the surface of the live cells in both infected and uninfected malaria parasites. It could differentiate parasite-infected red blood cells from other cells based on the size and fluorescence intensity of each cell.
Simple preparation without sample fixation leads to faster analysis and reduces the possibility of sample changes or even damage that may produce inaccurate data. This method only required dilution of the sample and application of a dye reagent. We used SYBR Green I, which is known to distinguish cells in a broad application [25,26]. In addition, a malaria scanner was designed as user-friendly and more accessible in the field, providing analysis in clinical malaria-endemic areas in the future.
Plasmodium knowlesi and P. falciparum could be detected well in both high and low ranges of parasitemia by the malaria scanner with higher sensitivity compared to microscopy. However, the method sensitivity relatively similar compared to FACS. The subjectivity of the microscope analysis and limited observed fields resulted in substantial variation [27]. Besides, parasitemia counting by FACS was relatively less than microscope and malaria scanner. This application was probably due to sample preparation, particularly during sample dilution, fixation, or dye staining processes that caused cell lysis and morphological changes.
A limitation of this method has used a sample from in vitro cultured parasite, it comes to possibilities that the result might differ from the clinical sample. Moreover, this analysis used a living parasite, which leads to RBC dehydration, having a consequence on a single-use sample. Dehydrated parasites have morphological alterations, resulting in improper analysis during extended periods [28]. The sensitivity is slightly affected by dilution and incubation time during the examination. The sample must be incubated for at least 8–10 min to ensure it properly stayed on the chamber or would not affect the image focus. Moreover, this method is still not able to distinguish different species of parasites. Thus, crosschecking by Giemsa staining is still needed. In image technique-based quantification analysis, the focusing step on parasite images is essential during examination [29]. Incubation time also slightly affected the fluorescence intensity that was produced from the DNA content in the sample [25].
In the end, this study supported the development of a computer malaria diagnostic system for P. knowlesi. Differentiation of malaria parasite species is required to improve this technique. Additionally, an evaluation of the current tool in the clinical sample is essential for clinical automation in malaria diagnostics. User-friendly, easy maintenance, fast and high sensitivity detection demonstrated that the malaria scanner could be potentially applied in a wide malaria research field, such as drug, antibodies, and vaccine efficiency evaluation.