

INTRODUCTION
Medical laboratories in Estonia commonly employ the anal swab method to diagnose Enterobius vermicularis. The prevalence of E. vermicularis detected using a single anal swab among nursery school children is found to be greater than 20% [1,2]. However, the single anal swab method cannot accurately estimate the true prevalence of E. vermicularis infection in a community [3]. Repeated examinations on separate days result in higher and more reliable estimations of the prevalence of the E. vermicularis infection [4,5].
Although repeated examinations may be considered too laborious for routine diagnosis of E. vermicularis, which is a low-level pathogenic helminth most common in children, accurate diagnosis of enterobiasis is essential to identify and treat infected individuals. Moreover, correct diagnosis is an important preventative measure for children, especially in nurseries, as communication companions are a major risk factor of enterobiasis [2]. It is essential to develop potential simple and cheap methods for identifying nursery groups with a high risk of enterobiasis and potentially high prevalence, and to draw attention to the need for prevention and cure.
The ratio of prevalence from single swab examinations to actual prevalence in the population is unclear, due in part to the nature of the life cycle of E. vermicularis. Though the life cycle takes place within the lumen of the gastrointestinal tract, microscopic examination of fecal samples is not recommended for diagnosis. Fecal samples give a positive diagnosis in only a few cases: 5-15% [5], or 3% [6]. Anal swab examination is the recommended method [4], although a positive result from an anal swab should not always be interpreted as a diagnostic criterion of a present infection, since positive cases may not have intestinal E. vermicularis, although negative cases may [7]. The anal swab test, the routine test for enterobiasis in Estonia, is simple, quick and inexpensive, but it is quite a poor test along with the alternative cellophane tape method that is widely used all over the world. The both tests detect eggs after the death of worms. Therefore, the already terminated parasitism is detected. The autoinfection is frequent, causing common co-occurrence of different life stages of the worms in the same child. The anal swab detects only worms that already have laid eggs and not the younger stages.
The proportion of positive results from a single anal swab can be far less than the actual prevalence of E. vermicularis infections. Cho and Kang [4] found that 81.3% of negative cases of single anal swabs had various development stages of E. vermicularis in the intestine. The repeated anal swab technique offers the chance to obtain a sample, when the worms have just laid their eggs. Incorrect sampling or microscoping can also result in false positives and negatives, although, if the examination is done by an experienced specialist, a false positive result is unlikely because the eggs of E. vermicularis are easy to recognize.
The ratio between anal swab results and actual Enterobius infection is affected by several factors, including the size of the parasite's brood, time intervals between reinfection, and the distribution of the E. vermicularis burden in the surveyed community [7]. A single perianal tape test used for pinworm detection in owl monkeys yielded a 1-in-4 chance that no pinworm eggs will be detected in an infected animal [8]. Sadun and Melvin [3] detected 60% positives using a single examination in a heavily-infected group, but only 37% positives in groups with a lower prevalence. A small number of egg-positive children in consecutive examinations may suggest that the worm burden in the positive children is low [9].
The increase in prevalence from repeated examinations has varied. Fan and Chan [10] found that the prevalence among nursery and kindergarten children increased from 17.3% and 34.6% from a single swab to 44.4% and 70.2% in 8 consecutive swabs; the prevalence among primary school students increased from 59.9% to 77.3% from 4 consecutive swabs. Kim et al. [11] found the increase of prevalence from 50.0-59.2% for single anal swabs to 70.8% from 3 anal swabs repeated at 4-5 day intervals. Two consecutive examinations may increase the egg detection rate by 4.2-4.8% for low (around 10%) enterobiasis prevalence [9]. The triple anal swab examinations presumably detect nearly 90% of infected individuals [3,5].
The present study was carried out in order to estimate the benefit of repeated examinations for the detection of enterobiasis in nursery school groups in Estonia, and to test the effectiveness of individual-based risk predictions using different methods. The issues addressed were as follows. What is the actual prevalence of enterobiasis in nursery school groups in Estonia? How large is the relative gain in prevalence (efficiency) from repeated examinations compared to a single examination? Is it possible to predict the estimated prevalence for multiple examinations from the results of a single anal swab examination in nursery school groups? Which are the best methods for individual-based predictions of the prevalence of infection in groups?
MATERIALS AND METHODS
The investigation of enterobiasis was conducted among nursery school children from 3 counties in Estonia during 2005-2007. The double swab examination in Põlva County was conducted in spring 2005, and in Hiiu County in autumn 2006. The triple swab examination in Valga County was conducted in spring and autumn 2007. The double swab examination involved 604 children from 57 groups in 23 nursery schools. There were 336 children (29 groups) from Põlva County, 140 (16 groups) from Hiiu and 128 (12 groups) from Valga County. Ninety-six children from 6 nursery schools in Valga County were investigated 3 times (Table 1). The number of examined children in a group varied between 2 and 23. Although some data is connected to individual children, the main outcomes of the study are at the nursery group level.
The data was obtained from 3 sources: 1) repeated anal swabs (at 1 or 2 day intervals) from children; 2) closed-ended questionnaires for children's parents; 3) observations of nursery schools and structured interviews with school staff. The aim of the interviews and observation of rooms was to identify possible infection risk factors for the groups. The observations concerned the number, purpose, sanitary conditions and state of repair of the rooms. The interviews concerned sanitation and children's hygiene, habits and cleanliness.
Infections of E. vermicularis were examined using the anal swab technique. Swabs were taken after breakfast just before the children went outside. One slide was prepared from each swab in the laboratory. The presence or absence of E. vermicularis eggs was determined, and the number of eggs was not determined.
The aim of the questionnaire was to identify possible factors for infection associated with children's homes, since enterobiasis spreads mainly in the indoor environment. The questions addressed 6 topics (the number of questions in brackets): personal data (5), household members and pet animals (3), previous occurrence of helminthiases in the family (2), socioeconomic status of the household (2), living conditions at home (8), and the child's habits and personal hygiene (3).
The second and third examinations, in addition to the first one, were considered separate single examinations with which to compare the effectiveness of repeated examinations and single examinations because the temporal order of the observations is not significant. The mean of single examinations served as the expected single-examination prevalence of enterobiasis in groups. Averaging the prevalence was used to reduce randomness in the results of single examinations and to diminish the number of zero-infected groups, and therefore, division by zero errors in the calculation of the relative gain. The average prevalence stands for the expected value of the estimated prevalence. The relative gain in the estimated prevalence (efficiency) for repeated examinations was calculated as:
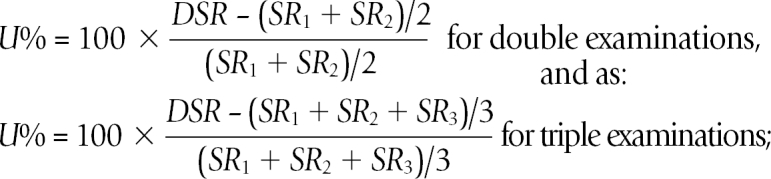
where U% = the efficiency of the double examination in percentages, DSR = the prevalence from double or triple examination, SR1, SR2, and SR3 = the prevalence from single examinations.
In order to model the risk of enterobiasis at individual level, a machine learning and prediction software Constud (http://www.geo.ut.ee/CONSTUD) [1] was compared to the data mining methods that fit a binomial dependent variable and a large number of nominal and numerical explanatory variables, and are not sensitive to missing values in explanatory variables. The following data mining methods in the Statistica 8 Data Miner (Statsoft) software package were compared: κ-nearest neighbours, boosting classification trees (BCT), random forest classification (RF), support vector machine, Naive Bayes classifier, advanced classification trees, automated neural network search. RF and BCT models were trained both in ëqual prior probabilities and estimated prior probabilities mode. The other methods do not accommodate prior probabilities. The missing values for variables were not altered because the assumptive values derived would be deceptively effective predictors if the prevalence in a set of observations that had missing values of any feature was biased from the overall mean.
Only the results of the first examination and information on their homes and nursery groups were used as training data. The total number of explanatory variables (features) for all methods formalized from questionnaires, interviews, nursery room observation and the child's personal data (age, gender) was 78. Not all characteristics were known for all children because some questions remained unanswered by parents and by supervisors. All available characteristics were used as training data for all modelling methods not giving any preference to the main risk factors known from previous investigations [1,2] where risk factors were compared one-by-one. The indicator value of single characteristics can differ greatly if taken alone or if in combination with other explanatory variables since many characteristics are intercorrelated or extensively duplicate each other.
The ultimate aim of the individual-based models was not to predict the enterobius positive/negative status in a child, but to estimate the enterobiasis prevalence in groups. We assumed that random biases in risk estimations should at least partially smooth out according to the law of large numbers.
Estimations derived from the results of the first examination were compared with the results of the following examinations. The fit of predictions is expressed as the proportion of correctly classified cases and as the true skill statistic (TSS-the proportion of true positives plus the proportion of true negatives minus one). TSS was preferred to the commonly used positive predictive value (PPV) since TSS is not dependent on prevalence [12]. The Ethics Review Committee on Human Research, University of Tartu has approved this investigation (records: 136/2, 21.03.2005).
RESULTS
The overall mean prevalence of enterobiasis from single anal swabs for children examined twice was 22.5%; double anal swabs increased the estimated prevalence to 30.7%. The average prevalence from single swabs for triple-swabbed children was 20.1%. The prevalence for double swabs was 30.2%, and the prevalence for triple swabs was 37.5%. The average efficiency of double examination for the whole data set was 36.7% (31.2% in Põlva, 37.7% in Hiiu, and 49.6% in Valga County). The efficiency of triple examination was 86.2% with respect to single examinations and 24.1% with respect to double examinations (Table 1).
The average prevalence of enterobiasis among nursery groups from 2 single examinations varied from 0 to 59.1%; 9 groups of 57 were non-infected. The mean group prevalence was 20.4%. The second examination failed to increase the prevalence in 12 groups, of which 9 were already identified as non-infected by the single examination. The prevalence increased by 100% in 10 groups. The prevalence was quite low in all these groups, 13.6% in 1 group and < 10% in the others. The overall mean increase in estimated prevalence resulting from the double examination was 7.0% (range 0-25%) in groups. The increase in the estimated prevalence was a function of the prevalence by the mean single examination: less in groups with a lower prevalence and more in groups with a higher prevalence, except for those groups with the highest preliminary prevalence (Table 2). The efficiency of double examination varied from 0 to 100%, the mean value in groups was 38.6%.
Children from 12 nursery groups in Valga County were examined 3 times. Two groups revealed no infections after all 3 examinations. The efficiency of triple examination relative to double examination was 0-50% in the remaining 10 infected groups and 50-200% relative to the single examination (Table 3). The estimated prevalence increased by 0-20.8% after triple examination compared to double examination.
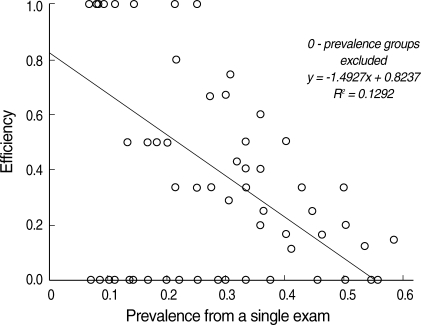
The relative effectiveness at group level for repeat examinations was found to be statistically related to the prevalence in the group, when the 0-prevalence groups (according to both single examinations) were excluded to avoid division by zero (Fig. 1). The repeat-examination is more effective in groups in which the prevalence of enterobiasis is lower (linear regression, R2 = 0.41, n = 57, P < 0.0001). Detection of Enterobius positive children is less likely when the overall infection burden is low. The added proportion of estimated prevalence expressed as a difference in percentages is in general somewhat greater in groups in which the prevalence estimation is higher; except for those groups whose proportion of Enterobius positive children was the highest according to the first examination. No significant statistical relationships of efficiency or added prevalence with other characteristics of nursery school groups were found.
The best TSS results for the 3 methods for predicting individual risk were RF using equal prior probabilities (63.6% correctly classified, TSS = 0.332), BCT using estimated prior probabilities (64.9%, TSS = 0.338), and machine learning using Constud (73.8%, TSS = 0.388). Constud was superior in recognizing true negative cases, while BCT and RF succeeded better in predicting true positive cases (Table 4).
The explanatory features selected by these 3 methods as the most useful for distinguishing positive and negative cases were not the same (Table 5). The classification tree methods relied more on child and family characteristics, whereas Constud selected characteristics of nursery groups. Region, child age, and range of ages in nursery school groups were among the 13 most indicative attributes in all 3 models.
The estimated overall prevalence calculated using the 3 methods was 31.1% according to Constud, 43.7% according to BCT, and 45.7% according to RF. The mean TSS-fit of Constud was lower in groups with more than 10 children (TSS = 0.295, versus TSS = 0.587, n = 31 and 28, P = 0.002, Mann-Whitney U-test). Many small groups were not infected and the few children in these groups were commonly identified as not infected. The prevalence estimations in groups calculated from individual level predictions varied between 0.17 and 1.0, but these still correlated strongly with the results of single (R = 0.666), double (R = 0.613) and triple examination (R = 0.583). Constud estimated 31.5% detection (SD = 0.268) for the mean prevalence in groups, which is greater than the single swab examination of 20.4% (SD = 0.162), 27.4% (SD = 0.201) for double examination, and 29.1% (SD = 0.216) for triple examination.
DISCUSSION
Single examinations for enterobiasis for prophylactic purposes in nurseries is faster and cheaper, but previous research has recommended multiple examinations, since single examination may fail to detect infected children [3-5,7-9,11].
Yoon et al. [9] found a 4.2% increase in prevalence after double examinations. They concluded that when a single examination indicates around 10% of infections, the result of a double examination may be about 4% higher. We observed a higher prevalence from single anal swabs for the entire sample population (22.5%) and a greater increase in repeated examinations. The prevalence increased by 8.2% as a result of double examinations, an increase of more than one-third from the single examination. Cho et al. [7] noted a 13.2% higher prevalence from double examinations compared to single examinations (first exam 73.5%, second 83.7%, cumulative 91.8%).
The prevalence in groups obtained from a single examination (0-59.1%) and the increase of prevalence using double examination (0-25%) varied greatly in this study. We divided the nursery groups into classes according to the single-estimated prevalence (Table 2). Although the increase of prevalence estimated using repeated examinations varied within groups, in general, the increase was greater in groups with a higher estimated prevalence from the first examination (maximum at 30-45%). Among the lowest prevalence group (up to 15%), the increase of prevalence (4.1%) is similar to the results from Yoon et al. [9], 5.5%. The increase is 9.5% at the next class and reaches a maximum of 11.3% at the 30-45% class. This class had an increase similar to that found by Cho et al. [7].
Both the absolute increase in estimated prevalence and the gain in relative figures characterize the added value of a double examination. The results of a double examination depend on the proportion of infected children and other characteristics of the group. The absolute increase in estimated prevalence compared to a single examination, as was calculated by Yoon et al. [9], appears to be a more stable predictor. The application of effectiveness as a relative indicator is justified if the gain from double investigation needs to be set forth in the conditions of a relatively low prevalence.
Cho and Kang [4] calculated a 62.9% prevalence combining double anal swabs and Neyman's best asymptotically normal estimate, but this was much lower than their reported pinworm occurrence (89.3%) from the thorough study of 3-day feces. Kim et al. [11] found the prevalence of 70.8% with a triple examination, an increase of 11.6-20.8% over a single examination. The estimated prevalence of enterobiasis in our study increased by 37.5% as a result of triple examinations, the difference from the rate of single examinations was 17.4%. Assuming triple examinations discovered 90% of actual prevalence as concluded in [3,5], the corresponding expected actual prevalence in our data would be 41.7%.
The 3 best methods for estimating individual risk levels (RF, BCT, and Constud) were able to predict the actual results of the second examination, about two-thirds correctly classified, TSS ≈ 0.35. The predicted overall prevalence from individual-based risk estimations varied considerably among the 3 best methods. The prevalence predicted by Constud (31.1%) is lower than that of BCT (43.7%) and RF (45.7%), but is closer to the observed value. Group level predictions of the mean prevalence match relatively well into the sequence: 20.4% from single anal swab, 27.4% from double, 29.1% from triple, and 31.15% from Constud.
The significant merits of the 3 best methods are the tolerance of missing values of explanatory variables, the lack of restrictions due to the statistical distribution of explanatory variables and the lack of a predefined theoretical model. The test for individual-based predictions of the prevalence of enterobiasis in independent groups remains for future investigations, since all double examined individuals were included in the comparison of the prediction methods. Reducing the number of observations in the training sample by excluding them from an independent test sample would yield in over fitting the models. The individual-based estimations were presented here to demonstrate a possible novel approach to prevalence estimation.
We suggest using the values of the mean increase of prevalence after double examination compared to a single exam (Table 2). Individual-level modelled risk predictions can support or be an alternative for the estimation of the expected prevalence of enterobiasis. Similarity-based machine learning and prediction in Constud was able to yield the highest overall fit of individual-based predictions while BCT and RF models were more effective in recognizing Enterobius positive persons.